Metro Vancouver
Large-format industrial leasing.
I focus on major industrial vacancies across Metro Vancouver.
My approach combines direct business development with high-quality property marketing. I identify the companies that can realistically use the space, find the decision-makers, pursue them directly, and support that work with video, digital marketing, broker outreach and the NAI network.
The objective is straightforward: create more qualified activity around the property.
Market data current to Q2 2026. Public listing observations updated September 1, 2026.
01 / The Job
For a 100,000+ SF vacancy, the tenant pool is usually small.
That changes the job. Broad exposure still matters, but the real work is identifying the companies that fit, understanding their timing, and getting in front of the people who can make the decision.
What I actually do
- 01Research the occupier market.
- 02Identify decision-makers.
- 03Call companies directly.
- 04Visit occupiers in person.
- 05Work with tenant-rep brokers.
- 06Use the NAI network where relevant.
- 07Produce professional video and digital collateral.
- 08Report activity and market feedback every week.
02 / The First Question
Before I market the building, I want to know why it hasn’t moved.
A property can remain available for a lot of reasons, and more exposure is not automatically the answer. The first job is figuring out what the market is reacting to.
Economics
Is the asking rent competitive after additional rent, inducements and escalations are considered?
Functional fit
Does the building's clear height, loading, yard, power and office component match the requirements active in the market?
Size
Is the building being marketed to one 200,000 SF user when there may be substantially more demand at 80,000 to 120,000 SF?
Timing
Can the landlord deliver when the realistic occupier pool needs possession?
Location
What does the tenant give up or gain versus Richmond, Delta, Surrey, Burnaby or Langley?
Target market
Are we waiting for inquiries, or have we identified the companies that actually fit?
The answer may be better marketing. It may also be pricing, divisibility, timing, economics or the wrong target universe. I want to know which one before spending money promoting it.
03 / The Market Today
The large-format market today
Greater Vancouver has more than 250 million square feet of industrial inventory, but only a small portion of that inventory is available in blocks large enough for a 100,000+ SF requirement. Cushman & Wakefield counted 17 available blocks above 100,000 SF at the end of Q2 2026, excluding buildings under construction. Only three were above 200,000 SF.
Despite that limited supply, several significant availabilities have remained publicly marketed for many months. That tells me something important: scarcity helps, but scarcity alone does not create a transaction.
254.1M SF
Industrial inventory
4.4%
Vacancy
6.7%
Future availability
$18.87 / SF
Avg. net asking rent
$6.16 / SF
Avg. additional rent
2.41M SF
Q2 leasing activity
1.15M SF
YTD net absorption
3.63M SF
Under construction
17 existing blocks over 100,000 SF.
Across a 254 million square foot market, the number of existing buildings that can answer a large-format requirement is countable on your hands. Change the filter and it nearly disappears.
Existing-building availabilities, Q2 2026; excludes buildings under construction.
17 existing availabilities over 100,000 SF
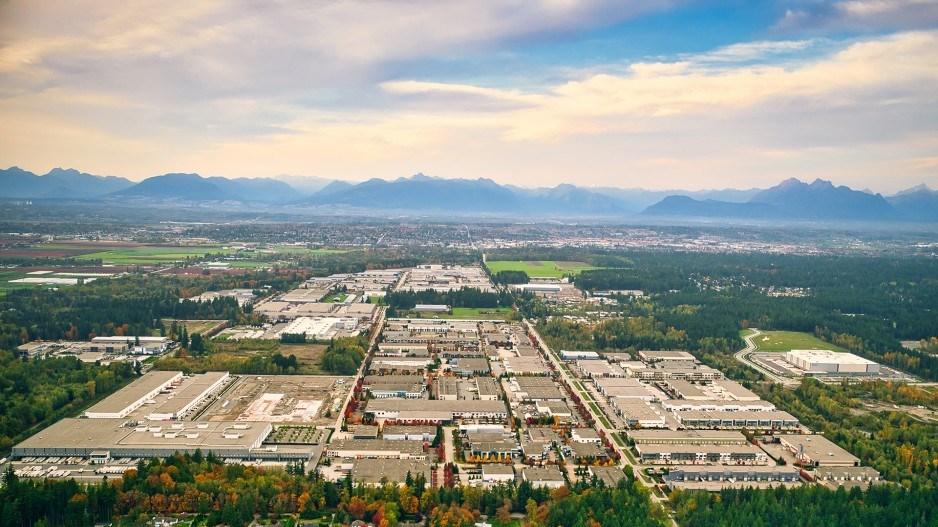
Campbell Heights, Surrey · one of the districts where large-format demand lands
Submarket photography · not a listed property
04 / Economics
Asking rent is only the starting point.
A tenant choosing between a $21.00 Richmond option and an $18.50 Surrey option isn’t simply choosing between two rents. They’re comparing transportation cost, labour, commute patterns, property taxes, loading, clear height, yard, operational efficiency, inducements and the cost of moving.
For the landlord, the question isn’t simply whether the face rate is above or below the market average. It’s whether the total economics are preventing the property from reaching the portion of the tenant universe most likely to transact.
 Richmond · submarket context
Richmond
Q2 2026 market data
- Vacancy
- 3.2%
- Net asking rent
- $21.02 / SF
- Additional rent
- $5.47 / SF
- Indicated gross
- $26.49 / SF
Indicated gross is net asking plus additional rent as reported; actual occupancy cost varies by building and deal structure.
Current public large-format asks against their submarket average
Richmond
Submarket avg $21.02
Delta
Submarket avg $17.71
Surrey
Submarket avg $18.56
Langley
Submarket avg $18.62
A large-format ask above the submarket average is not automatically wrong, and one below it is not automatically cheap. Rents at this scale carry clear height, yard, cross-dock configuration, rail, food-grade certification, power, dock ratio, office component, age, term, credit and inducements. Submarket averages are benchmarks, not direct comparables, and effective economics matter more than face rent.
The economics behind a large-format deal
- Base (net) rent
- The face rate per square foot. The number everyone quotes, and the least complete.
- Additional rent
- Taxes, operating costs and management. On large-format product this can move total occupancy cost by 25 to 40 percent, and tenants model it.
- Free rent
- Early-term abatement. Often the cleanest lever to bridge an economics gap without resetting face rate or comparables.
- Fixturing period
- Non-paying access for racking, equipment and permits. At 100,000+ SF, fixturing timelines are a real negotiation, not a formality.
- Tenant improvements
- Landlord capital toward the tenant's build-out. Interacts directly with term length and credit.
- Annual escalations
- Fixed steps compound. A lower face rate with stronger escalations can out-earn a higher flat rate over a ten-year term.
- Term
- Longer terms amortize capital and de-risk income; shorter terms preserve repositioning options. The right answer is portfolio-specific.
- Renewal options
- Options shift future leverage to the tenant. They are priced, not given away.
05 / The Cost of Time
What downtime is worth.
100,000 SF × $18.87 net
$1.887M
≈ $157,250 / month
Annualized base rent
200,000 SF × $18.87 net
$3.774M
≈ $314,500 / month
Annualized base rent
400,000 SF × $18.87 net
$7.548M
≈ $629,000 / month
Annualized base rent
Illustrative annualized base-rent scale using the Q2 2026 Greater Vancouver average asking rent. This is not a vacancy-loss calculation, valuation or projection of achievable rent.
The point isn’t that every month of marketing equals a month of lost rent. The point is that at large-format scale, shortening the path to the right occupier has meaningful economic value, which is why the diagnostic work in the sections above is worth doing before the building goes to market rather than after it stalls.
06 / Recent Demand
Who is actually leasing.
Large deals are getting done. Seven new leases over 50,000 SF completed in Q2, nearly 700,000 SF in total, about 29 percent of the quarter’s leasing volume. The useful question for an owner is not whether demand exists; it is which companies are most likely to produce the next requirement of this size.
7
New leases over 50,000 SF
≈700,000 SF
Combined large-lease volume
29%
Of Q2 leasing volume
Publicly reported market transactions, Q2 2026. Shown as evidence of occupier activity; not Samuel Brahem / NAI transactions.
07 / Competing Inventory
What the building is competing against.
Any serious prospect will see some version of this list from their broker before responding to a proposal. These are the publicly marketed 100,000+ SF availabilities across Greater Vancouver, with how long each has been exposed to the market.
Large-Format Market Watch
Publicly marketed industrial availability · observed September 1, 2026
Public marketing duration reflects the earliest public portal date verified in this review. It does not represent the commencement date or expiry date of any brokerage service agreement and may include re-listings, changes in availability, subleases or evolving marketing programs.
Marketing teams are anonymized on this page and grouped by overlapping listing personnel on the public listing pages. The named breakdown is part of the market review.
Mandate concentration
Six of the nine are marketed by one overlapping team.
That is not a criticism. Strong teams win multiple mandates in every market, and the overlap is verifiable from the public listing pages. But it creates a structural question for an individual owner: when one team is marketing several buildings that compete for the same short list of tenants, your building is one of several places a serious inquiry can land.
My model is the opposite. I am not asking any owner for a portfolio. Give me one building. It becomes my only large-format mandate, and every requirement I find has exactly one place to go.
08 / The Tenant Universe
Build the tenant universe before waiting for the tenant.
For a 20,000 SF unit, broad market exposure may produce enough inquiry volume to generate options. At 150,000 or 250,000 SF, the universe is different. I want to know who can actually make the move.
For every plausible occupier, I would want to understand:
Situation
- Current footprint
- Existing locations
- Current submarket
- Headcount
- Labour access
- Port / border dependence
Signals
- Likely lease timing
- Expansion / contraction
- M&A activity
- New contracts
- New market entry
- Distribution geography
Requirements
- Clear height
- Loading
- Yard
- Power
- Rail
- Food grade
- Cold storage
- Build-to-suit potential
The deliverable isn’t a database. It’s a prioritized list of companies worth pursuing now, companies worth developing over the next 12 to 24 months, and companies that should be ruled out.
09 / Decision-Makers
A major facility decision rarely belongs to one contact.
A 100,000+ SF commitment moves between operations, supply chain, real estate, finance and executive leadership, often through a head office in another city. Part of the research is mapping who is actually involved in the decision at each company, so the pursuit is aimed at people with authority rather than whoever answers the inquiry line.
10 / Pursuit
Then we pursue the accounts.
Once the market has been narrowed, the work becomes straightforward but labour-intensive.
- 01Determine who controls the real estate decision.
- 02Find a credible reason to approach them.
- 03Contact them directly.
- 04Follow up consistently.
- 05Work through their broker where they are represented.
- 06Stay close enough to the company that we know when timing changes.
- 07Keep every conversation in the database, so a requirement that doesn't fit this asset may fit another one in the owner's portfolio.
None of this is complicated. It is disciplined, repetitive work over months, and it is the part of a large-format assignment that most often goes undone once the initial launch settles into waiting.
11 / Portfolio Owners
A portfolio changes the way I would run the process.
A tenant rejecting one building should not mean losing the requirement. If an occupier needs 140,000 SF and Building A doesn’t work because of economics, that requirement should immediately be tested against Buildings B, C and D. If none work today, the company should remain in the pipeline against upcoming availability.
Over time, the owner should be building a proprietary picture of demand across the portfolio, not starting from zero every time a vacancy appears.
Illustrative requirement
150,000 SF · 3PL
- 32' clear preferred
- 20+ dock doors
- Large secured yard
- Highway access
- Q3 2027 occupancy
Property A — Richmond
Toured. Declined on economics.
Property B — Burnaby
Routed. Configuration fits; tour booked.
Property C — Delta
Held as alternate; yard advantage.
Property D — Langley
Logged against 2027 timing.
Every conversation should make the portfolio easier to lease.
12 / The Brokerage Community
Tenant-rep brokers often know requirements before they become public.
The brokerage community remains one of the most productive channels for large industrial requirements, and every assignment should cover it thoroughly. Direct occupier pursuit runs alongside that coverage, not instead of it, so the property reaches both the requirements brokers are working and the companies that have not engaged a broker yet.
- Metro Vancouver industrial brokers
- National occupier teams
- Corporate-services teams
- Broker databases
- NAI Global member firms
- Market-specific specialists
13 / Out-of-Market Demand
The next occupier may not be in Vancouver yet.
Out-of-market demand is researched, not wished for. The work tracks companies entering Western Canada, Canadian operators expanding west, US companies establishing Canadian distribution, national retailers changing logistics networks, manufacturers relocating, 3PL contract wins, M&A and corporate consolidation.
The NAI network operates as a distribution and relationship layer on top of that research. Where the property warrants it, the pursuit extends beyond the local market.
14 / Property Presentation
The property should be easy to evaluate.
An operations team assessing a 100,000+ SF building has specific questions, and the presentation should answer them before the first tour: photography, drone and video planned around what a tenant actually needs to verify, on a dedicated property page that is easy to find and easy to circulate internally.
SITE CONTEXT
How does the site connect to the highway network and the port?
TRUCK COURT
Can a 53' trailer maneuver efficiently at peak?
DOCK LOADING
What throughput can the loading configuration support?
WAREHOUSE / CLEAR HEIGHT
How much usable cube does the tenant actually receive?
YARD
What can genuinely be staged, parked or stored outside?
POWER + ACCESS
Will the service and the commute work for this operation?
Photography · drone · video · dedicated property page · collateral built for internal circulation
15 / The First 90 Days
How the first 90 days run.
Property audit · Market benchmark · Competing inventory · Tenant universe · Decision-maker research · Property presentation · Broker database · Distribution infrastructure
Full market launch · Broker distribution · First wave of account pursuit · Search visibility · Video live
Calling · Email · LinkedIn · Executive outreach · Physical outreach · Tenant-rep coverage · NAI introductions · Tour conversion
Second-wave accounts · Non-responsive account recycling · National occupier search · Industry-specific pursuit · Market feedback · Economics review
Re-engagement · Objection analysis · Positioning changes · New timing signals · Portfolio cross-routing · Ownership strategy review
The plan above is a starting shape, not a script. It is tailored to the property, the market and ownership objectives, and it should be running sharper in week twelve than in week one because of what the market has said in between.
16 / Reporting
What the owner sees every week.
Owners should never have to wonder what is happening behind their listing. Weekly reporting covers who was researched, who was reached, what they said, and what happens next. Just as important is what the market’s objections add up to: a no without a reason is wasted information, and a pattern of reasons is a strategy input.
WEEKLY ACTIVITY
Market feedback → strategy response
Illustrative reporting structure. Live assignments report actual counts, named activity and verbatim feedback to ownership weekly.
17 / Background
Why my approach looks different.
Before moving into commercial real estate, my career was in enterprise business development. The work was fundamentally similar to what a difficult large-format leasing assignment requires: identify a limited universe of organizations, understand who makes the decision, create a reason for them to engage, manage multiple stakeholders and stay with the opportunity through a long sales cycle.
I brought that operating discipline into brokerage. The difference is that now the product is industrial real estate.
6 years
Enterprise B2B sales before brokerage
$45M+
Qualified pipeline generated and managed at Truspace
$12M
The firm's largest opportunity to date, in a region with no prior wins
9 of 10
Quarters over quota at Lumen5
If you have a large-format vacancy, I’ll show you how I see the market.
Give me the size, location and basic specifications. I’ll come prepared with the current competing inventory, market economics, the occupier categories I think matter, and an initial view on where I would focus.
Then we can spend twenty minutes comparing notes.
And to be clear about the ask: I am not pitching for a portfolio. One building is enough to judge the work.
Industrial Sales & Leasing
NAI Commercial (BC) Ltd.
Samuel Brahem, Industrial Sales and Leasing, NAI Commercial (BC) Ltd., 1075 West Georgia Street, Suite 1300, Vancouver, BC. Assignments are considered across British Columbia, with primary market coverage in Metro Vancouver, the Lower Mainland and the Fraser Valley. Market statistics reflect third-party institutional research current to Q2 2026; public listing observations were reviewed September 1, 2026. This page presents that market research together with a general description of leasing advisory services. It does not advertise any other brokerage’s listing, identify any brokerage or owner in connection with marketing duration, or invite any party to breach an existing agency agreement. Process diagrams are illustrative.