Blog
Industrial real estate,
written down.
Insights, market commentary, and analysis on Metro Vancouver industrial real estate. Submarket reports, lease economics, asset trends, and industry coverage, updated regularly.

All Posts
Market Reports · 6 min read
Vancouver-Proper Industrial Market: Scarcity Driving Premium Positioning
An in-depth analysis of Vancouver's urban industrial market, examining how land constraints and rezoning pressures are reshaping lease rates, availability, and investment strategy.
Jun 18, 2026
Read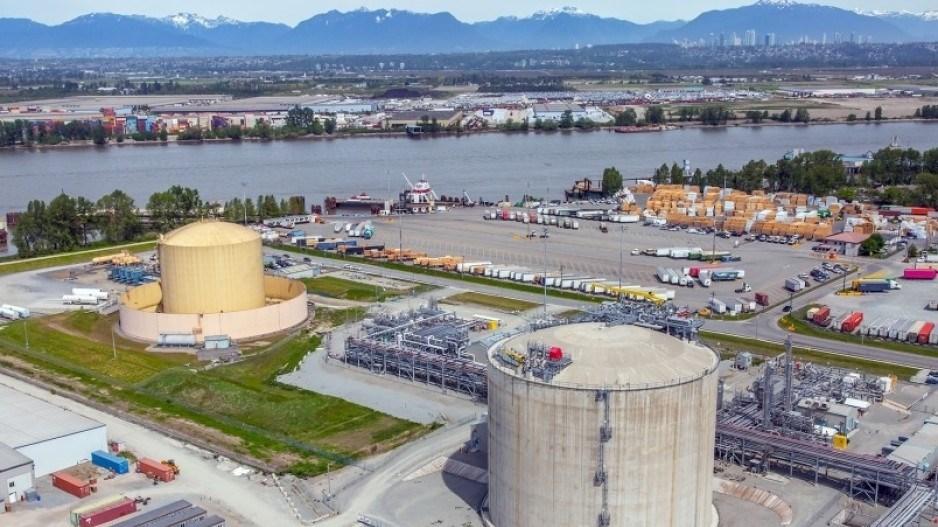
Submarkets · 6 min read
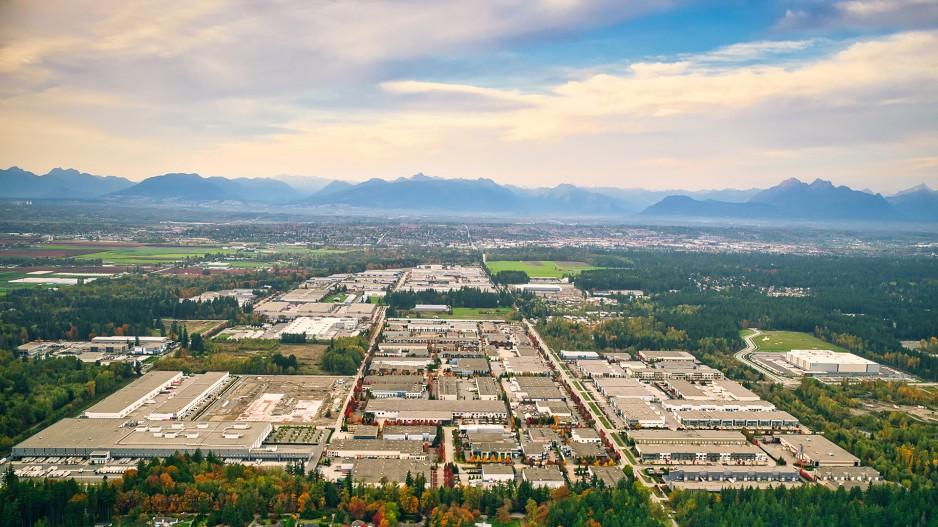
Langley and Aldergrove: Metro Vancouver's Expanding Industrial Corridor
The Langley-Aldergrove corridor has emerged as one of Metro Vancouver's most active industrial growth zones, offering larger land parcels and competitive rates for users priced out of core markets.
Jun 16, 2026
Read
Asset Classes · 9 min read
Science and Research Facilities in Greater Vancouver: A Practical Guide to Lab, Cleanroom, and GMP Space
Lab, cleanroom, and GMP-ready space is the most specialized corner of Metro Vancouver's industrial market. Here's where it concentrates, what it costs, and how biotech, medtech, and research occupiers should approach site selection.
Jun 11, 2026
Read
Asset Classes · 6 min read
Flex Industrial Space in Greater Vancouver: What Owners and Tenants Should Know
Flex industrial properties offer versatile configurations for businesses needing both warehouse and office functions. Here's how this asset class performs across Metro Vancouver submarkets.
Jun 11, 2026
Read
Submarkets · 6 min read
Richmond Industrial Market: Inside Metro Vancouver's Cold Storage Hub
Richmond's industrial market has evolved into a specialized cold storage and distribution cluster. Here's what owners, occupiers, and investors need to know about this unique submarket.
Jun 9, 2026
Read
Industry News · 4 min read
The 32 Avenue Widening Isn't a Road Project. It's Campbell Heights' Next Supply Pipeline.
Surrey, TransLink and BC Hydro are jointly installing the road, power and drainage capacity that unlocks the next wave of Campbell Heights industrial. The clue is in the drainage scope.
Jun 6, 2026
Read
Regulation · 6 min read
Industrial Zoning Across BC Municipalities: What Owners and Tenants Must Know
Understanding how industrial zoning varies across Metro Vancouver municipalities is essential for site selection, expansion planning, and investment decisions in a supply-constrained market.
Jun 4, 2026
Read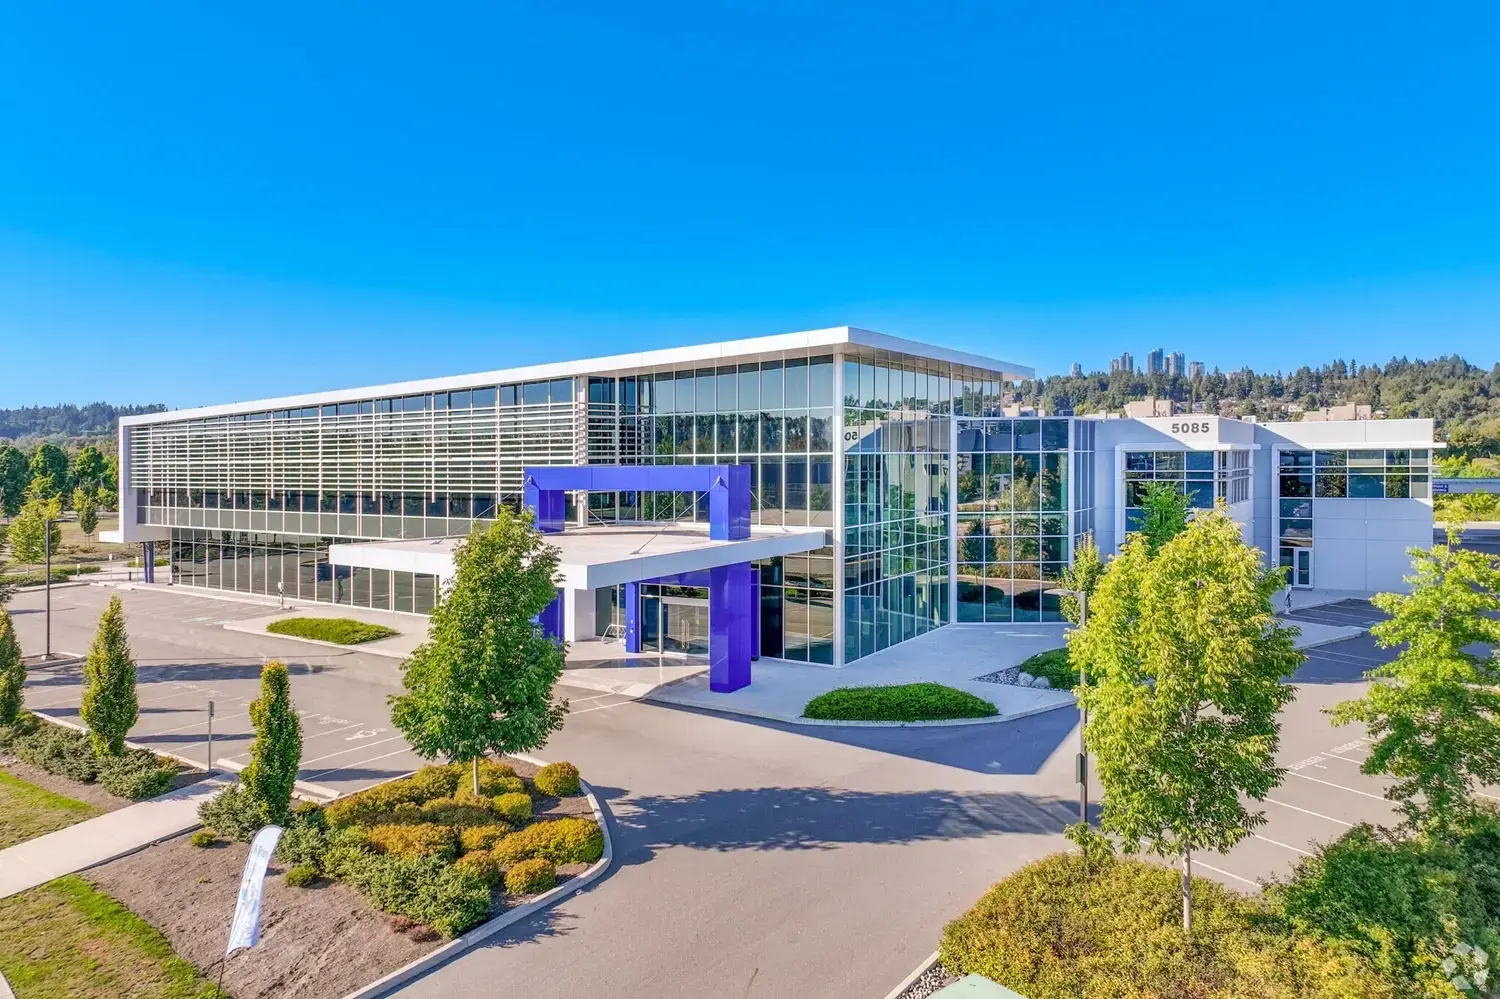
Asset Classes · 6 min read
Flex Industrial Space in Greater Vancouver: A Practical Guide
Flex industrial properties offer a hybrid solution for businesses needing warehouse, office, and showroom space under one roof. Here's what owners and tenants should know about this asset class in Metro Vancouver.
Jun 2, 2026
Read
Industry News · 5 min read
Vancouver Broker Builds IndustrialVancouver.ca to Help Companies Find Usable Industrial Space, Not Just Listings
Metro Vancouver businesses searching for industrial space face a gap between available listings and what is actually usable. IndustrialVancouver.ca was built to close it.
Jun 1, 2026
Read
Market Reports · 7 min read
Metro Vancouver Industrial Mid-2026 Market Pulse
A read on Metro Vancouver industrial real estate at mid-2026: vacancy, lease rates, absorption, and submarket performance across the Lower Mainland.
May 28, 2026
Read